JavaScript is disabled for your browser. Some features of this site may not work without it.
Buscar en RiuNet
Listar
Mi cuenta
Estadísticas
Ayuda RiuNet
Admin. UPV
Studying connectivity between time-series using an interactive application
Mostrar el registro sencillo del ítem
Ficheros en el ítem
| dc.contributor.author | López-Madrona, Víctor J.
|
es_ES |
| dc.contributor.author | Moratal, David
|
es_ES |
| dc.contributor.author | Bénar, Christian G.
|
es_ES |
| dc.date.accessioned | 2021-11-17T08:07:59Z | |
| dc.date.available | 2021-11-17T08:07:59Z | |
| dc.date.issued | 2021-07-06 | es_ES |
| dc.identifier.isbn | 978-84-09-31267-2 | es_ES |
| dc.identifier.issn | 2340-1117 | es_ES |
| dc.identifier.uri | http://hdl.handle.net/10251/177202 | |
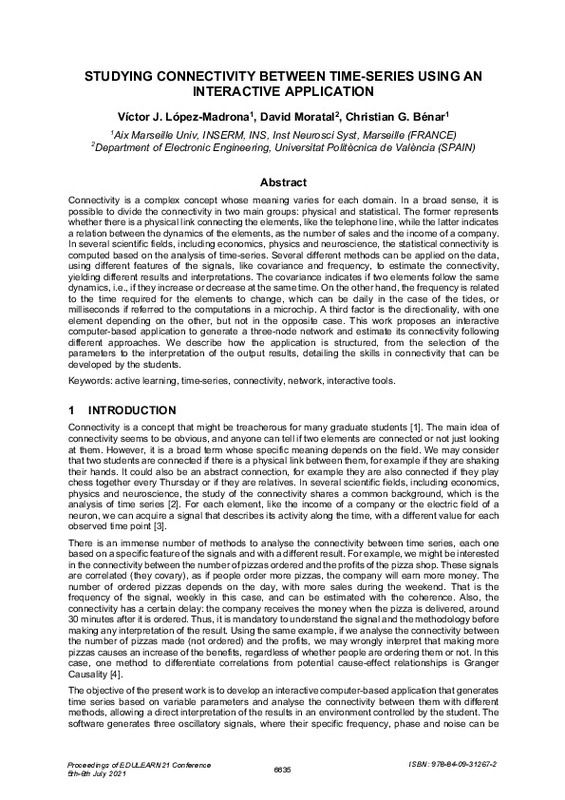
| dc.description.abstract | [EN] Connectivity is a complex concept whose meaning varies for each domain. In a broad sense, it is possible to divide the connectivity in two main groups: physical and statistical. The former represents whether there is a physical link connecting the elements, like the telephone line, while the latter indicates a relation between the dynamics of the elements, as the number of sales and the income of a company. In several scientific fields, including economics, physics and neuroscience, the statistical connectivity is computed based on the analysis of time-series. Several different methods can be applied on the data, using different features of the signals, like covariance and frequency, to estimate the connectivity, yielding different results and interpretations. The covariance indicates if two elements follow the same dynamics, i.e., if they increase or decrease at the same time. On the other hand, the frequency is related to the time required for the elements to change, which can be daily in the case of the tides, or milliseconds if referred to the computations in a microchip. A third factor is the directionality, with one element depending on the other, but not in the opposite case. This work proposes an interactive computer-based application to generate a three-node network and estimate its connectivity following different approaches. We describe how the application is structured, from the selection of the parameters to the interpretation of the output results, detailing the skills in connectivity that can be developed by the students. | es_ES |
| dc.language | Inglés | es_ES |
| dc.publisher | IATED Academy | es_ES |
| dc.relation.ispartof | EDULEARN21 Proceedings | es_ES |
| dc.rights | Reserva de todos los derechos | es_ES |
| dc.subject | Active learning | es_ES |
| dc.subject | Time-series | es_ES |
| dc.subject | Connectivity | es_ES |
| dc.subject | Network | es_ES |
| dc.subject | Interactive tools | es_ES |
| dc.subject.classification | TECNOLOGIA ELECTRONICA | es_ES |
| dc.title | Studying connectivity between time-series using an interactive application | es_ES |
| dc.type | Comunicación en congreso | es_ES |
| dc.type | Artículo | es_ES |
| dc.type | Capítulo de libro | es_ES |
| dc.identifier.doi | 10.21125/edulearn.2021.1342 | es_ES |
| dc.rights.accessRights | Abierto | es_ES |
| dc.contributor.affiliation | Universitat Politècnica de València. Departamento de Ingeniería Electrónica - Departament d'Enginyeria Electrònica | es_ES |
| dc.description.bibliographicCitation | López-Madrona, VJ.; Moratal, D.; Bénar, CG. (2021). Studying connectivity between time-series using an interactive application. IATED Academy. 6635-6638. https://doi.org/10.21125/edulearn.2021.1342 | es_ES |
| dc.description.accrualMethod | S | es_ES |
| dc.relation.conferencename | 13th International Conference on Education and New Learning Technologies (EDULEARN 2021) | es_ES |
| dc.relation.conferencedate | Julio 05-06,2021 | es_ES |
| dc.relation.conferenceplace | Online | es_ES |
| dc.relation.publisherversion | https://doi.org/10.21125/edulearn.2021.1342 | es_ES |
| dc.description.upvformatpinicio | 6635 | es_ES |
| dc.description.upvformatpfin | 6638 | es_ES |
| dc.type.version | info:eu-repo/semantics/publishedVersion | es_ES |
| dc.relation.pasarela | S\448885 | es_ES |


