JavaScript is disabled for your browser. Some features of this site may not work without it.
Buscar en RiuNet
Listar
Mi cuenta
Estadísticas
Ayuda RiuNet
Admin. UPV
Dashboards and visualisation tools for enhancing creativity in business master students
Mostrar el registro sencillo del ítem
Ficheros en el ítem
| dc.contributor.author | González-Ladrón-de-Guevara, Fernando
|
es_ES |
| dc.contributor.author | Fernández-Diego, Marta
|
es_ES |
| dc.date.accessioned | 2021-11-19T10:56:20Z | |
| dc.date.available | 2021-11-19T10:56:20Z | |
| dc.date.issued | 2021-03-09 | es_ES |
| dc.identifier.isbn | 978-84-09-27666-0 | es_ES |
| dc.identifier.issn | 2340-1079 | es_ES |
| dc.identifier.uri | http://hdl.handle.net/10251/177288 | |
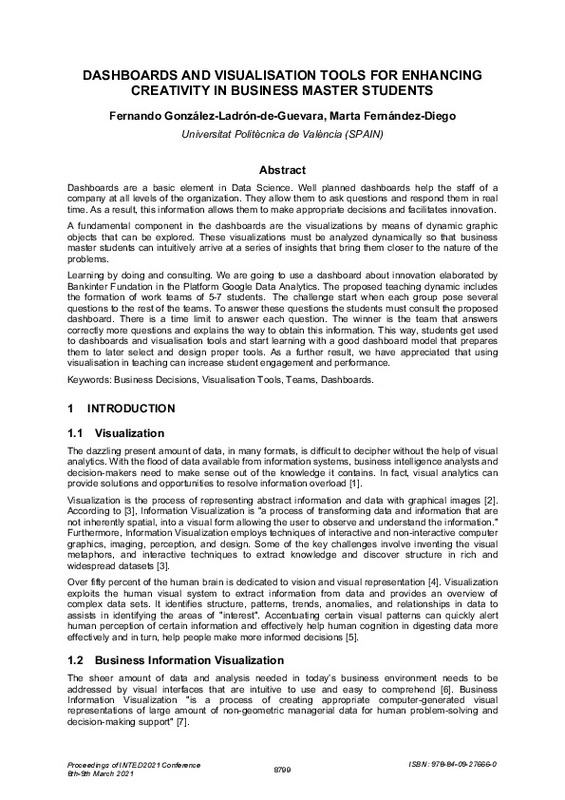
| dc.description.abstract | [EN] Dashboards are a basic element in Data Science. Well planned dashboards help the staff of a company at all levels of the organization. They allow them to ask questions and respond them in real time. As a result, this information allows them to make appropriate decisions and facilitates innovation. A fundamental component in the dashboards are the visualizations by means of dynamic graphic objects that can be explored. These visualizations must be analyzed dynamically so that business master students can intuitively arrive at a series of insights that bring them closer to the nature of the problems. Learning by doing and consulting. We are going to use a dashboard about innovation elaborated by Bankinter Fundation in the Platform Google Data Analytics. The proposed teaching dynamic includes the formation of work teams of 5-7 students. The challenge start when each group pose several questions to the rest of the teams. To answer these questions the students must consult the proposed dashboard. There is a time limit to answer each question. The winner is the team that answers correctly more questions and explains the way to obtain this information. This way, students get used to dashboards and visualisation tools and start learning with a good dashboard model that prepares them to later select and design proper tools. As a further result, we have appreciated that using visualisation in teaching can increase student engagement and performance. | es_ES |
| dc.language | Inglés | es_ES |
| dc.publisher | IATED | es_ES |
| dc.relation.ispartof | INTED2021 Proceedings | es_ES |
| dc.rights | Reserva de todos los derechos | es_ES |
| dc.subject | Business decisions | es_ES |
| dc.subject | Visualisation tools | es_ES |
| dc.subject | Teams | es_ES |
| dc.subject | Dashboards | es_ES |
| dc.subject.classification | ORGANIZACION DE EMPRESAS | es_ES |
| dc.title | Dashboards and visualisation tools for enhancing creativity in business master students | es_ES |
| dc.type | Comunicación en congreso | es_ES |
| dc.type | Artículo | es_ES |
| dc.type | Capítulo de libro | es_ES |
| dc.identifier.doi | 10.21125/inted.2021.1836 | es_ES |
| dc.rights.accessRights | Abierto | es_ES |
| dc.contributor.affiliation | Universitat Politècnica de València. Departamento de Organización de Empresas - Departament d'Organització d'Empreses | es_ES |
| dc.description.bibliographicCitation | González-Ladrón-De-Guevara, F.; Fernández-Diego, M. (2021). Dashboards and visualisation tools for enhancing creativity in business master students. IATED. 8799-8804. https://doi.org/10.21125/inted.2021.1836 | es_ES |
| dc.description.accrualMethod | S | es_ES |
| dc.relation.conferencename | 15th International Technology, Education and Development Conference (INTED 2021) | es_ES |
| dc.relation.conferencedate | Marzo 08-09,2021 | es_ES |
| dc.relation.conferenceplace | Online | es_ES |
| dc.relation.publisherversion | https://doi.org/10.21125/inted.2021.1836 | es_ES |
| dc.description.upvformatpinicio | 8799 | es_ES |
| dc.description.upvformatpfin | 8804 | es_ES |
| dc.type.version | info:eu-repo/semantics/publishedVersion | es_ES |
| dc.relation.pasarela | S\448903 | es_ES |


