JavaScript is disabled for your browser. Some features of this site may not work without it.
Buscar en RiuNet
Listar
Mi cuenta
Estadísticas
Ayuda RiuNet
Admin. UPV
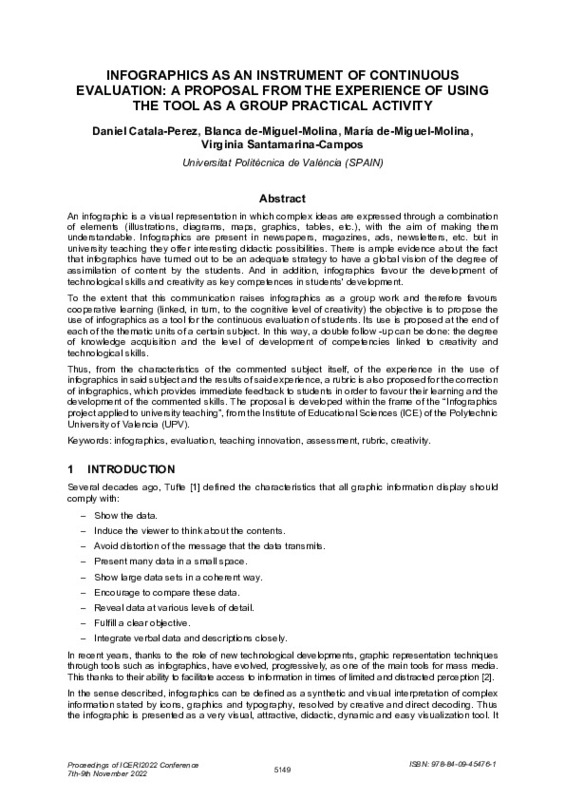
Infographics as an instrument of continuous evaluation: a proposal from the experience of using the tool as a group practical activity
Mostrar el registro sencillo del ítem
Ficheros en el ítem
| dc.contributor.author | Catalá-Pérez, Daniel
|
es_ES |
| dc.contributor.author | de-Miguel-Molina, Blanca
|
es_ES |
| dc.contributor.author | de-Miguel-Molina, María
|
es_ES |
| dc.contributor.author | Santamarina-Campos, V.
|
es_ES |
| dc.date.accessioned | 2023-02-17T07:24:12Z | |
| dc.date.available | 2023-02-17T07:24:12Z | |
| dc.date.issued | 2022-11-09 | es_ES |
| dc.identifier.isbn | 978-84-09-45476-1 | es_ES |
| dc.identifier.issn | 2340-1095 | es_ES |
| dc.identifier.uri | http://hdl.handle.net/10251/191889 | |
| dc.description.abstract | [EN] An infographic is a visual representation in which complex ideas are expressed through a combination of elements (illustrations, diagrams, maps, graphics, tables, etc.), with the aim of making them understandable. Infographics are present in newspapers, magazines, ads, newsletters, etc. but in university teaching they offer interesting didactic possibilities. There is ample evidence about the fact that infographics have turned out to be an adequate strategy to have a global vision of the degree of assimilation of content by the students. And in addition, infographics favour the development of technological skills and creativity as key competences in students' development. To the extent that this communication raises infographics as a group work and therefore favours cooperative learning (linked, in turn, to the cognitive level of creativity) the objective is to propose the use of infographics as a tool for the continuous evaluation of students. Its use is proposed at the end of each of the thematic units of a certain subject. In this way, a double follow -up can be done: the degree of knowledge acquisition and the level of development of competencies linked to creativity and technological skills. Thus, from the characteristics of the commented subject itself, of the experience in the use of infographics in said subject and the results of said experience, a rubric is also proposed for the correction of infographics, which provides immediate feedback to students in order to favour their learning and the development of the commented skills. The proposal is developed within the frame of the ¿Infographics project applied to university teaching¿, from the Institute of Educational Sciences (ICE) of the Polytechnic University of Valencia (UPV). | es_ES |
| dc.description.sponsorship | The present teaching experience is framed in the Teaching Innovation and Improvement Project, called Infographies. Use of ICT in the visual and creative representation of content in teaching funded by the Institute of Education Sciences (ICE) of the Polytechnic University of València. We want to thank the ICE of the UPV for facilitating that teaching scenarios are generated, which have resulted in such enriching results, both for students and for teachers and for promoting research in teaching. | es_ES |
| dc.language | Inglés | es_ES |
| dc.publisher | IATED | es_ES |
| dc.relation.ispartof | ICERI2022 Proceedings | es_ES |
| dc.rights | Reserva de todos los derechos | es_ES |
| dc.subject | Infographics | es_ES |
| dc.subject | Evaluation | es_ES |
| dc.subject | Teaching innovation | es_ES |
| dc.subject | Assessment | es_ES |
| dc.subject | Rubric | es_ES |
| dc.subject | Creativity | es_ES |
| dc.subject.classification | PINTURA | es_ES |
| dc.subject.classification | ORGANIZACION DE EMPRESAS | es_ES |
| dc.title | Infographics as an instrument of continuous evaluation: a proposal from the experience of using the tool as a group practical activity | es_ES |
| dc.type | Comunicación en congreso | es_ES |
| dc.type | Artículo | es_ES |
| dc.type | Capítulo de libro | es_ES |
| dc.identifier.doi | 10.21125/iceri.2022.1254 | es_ES |
| dc.rights.accessRights | Abierto | es_ES |
| dc.contributor.affiliation | Universitat Politècnica de València. Facultad de Bellas Artes - Facultat de Belles Arts | es_ES |
| dc.contributor.affiliation | Universitat Politècnica de València. Facultad de Administración y Dirección de Empresas - Facultat d'Administració i Direcció d'Empreses | es_ES |
| dc.description.bibliographicCitation | Catalá-Pérez, D.; De-Miguel-Molina, B.; De-Miguel-Molina, M.; Santamarina-Campos, V. (2022). Infographics as an instrument of continuous evaluation: a proposal from the experience of using the tool as a group practical activity. IATED. 5149-5155. https://doi.org/10.21125/iceri.2022.1254 | es_ES |
| dc.description.accrualMethod | S | es_ES |
| dc.relation.conferencename | 15th International Conference of Education, Research and Innovation (ICERI 2022) | es_ES |
| dc.relation.conferencedate | Noviembre 07-09,2022 | es_ES |
| dc.relation.conferenceplace | Seville, Spain | es_ES |
| dc.relation.publisherversion | https://doi.org/10.21125/iceri.2022.1254 | es_ES |
| dc.description.upvformatpinicio | 5149 | es_ES |
| dc.description.upvformatpfin | 5155 | es_ES |
| dc.type.version | info:eu-repo/semantics/publishedVersion | es_ES |
| dc.relation.pasarela | S\476480 | es_ES |
| dc.contributor.funder | Universitat Politècnica de València | es_ES |


