JavaScript is disabled for your browser. Some features of this site may not work without it.
Buscar en RiuNet
Listar
Mi cuenta
Estadísticas
Ayuda RiuNet
Admin. UPV
Análisis regional de frecuencia de precipitaciones extremas en el Norte de Mozambique
Mostrar el registro sencillo del ítem
Ficheros en el ítem
| dc.contributor.author | Álvarez, M.
|
es_ES |
| dc.contributor.author | Puertas, J.
|
es_ES |
| dc.contributor.author | Peña, E.
|
es_ES |
| dc.coverage.spatial | east=39.32062410000003; north=-12.3335474; name=Cabo Delgado, Moçambic | |
| dc.date.accessioned | 2017-01-20T12:29:11Z | |
| dc.date.available | 2017-01-20T12:29:11Z | |
| dc.date.issued | 2016-01-29 | |
| dc.identifier.issn | 1134-2196 | |
| dc.identifier.uri | http://hdl.handle.net/10251/77099 | |
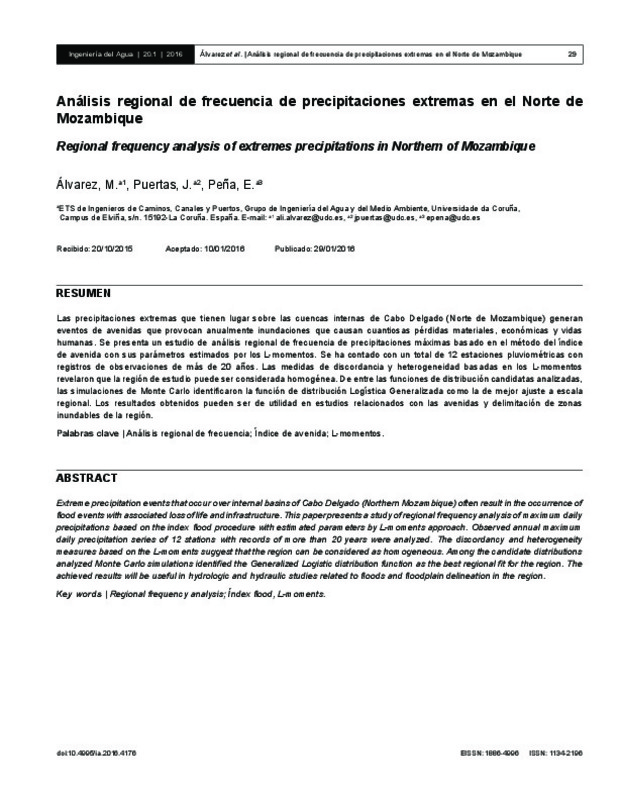
| dc.description.abstract | [EN] Extreme precipitation events that occur over internal basins of Cabo Delgado (Northern Mozambique) often result in the occurrence of flood events with associated loss of life and infrastructure. This paper presents a study of regional frequency analysis of maximum daily precipitations based on the index flood procedure with estimated parameters by L-moments approach. Observed annual maximum daily precipitation series of 12 stations with records of more than 20 years were analyzed. The discordancy and heterogeneity measures based on the L-moments suggest that the region can be considered as homogeneous. Among the candidate distributions analyzed Monte Carlo simulations identified the Generalized Logistic distribution function as the best regional fit for the region. The achieved results will be useful in hydrologic and hydraulic studies related to floods and floodplain delineation in the region. | es_ES |
| dc.description.abstract | [ES] Las precipitaciones extremas que tienen lugar sobre las cuencas internas de Cabo Delgado (Norte de Mozambique) generan eventos de avenidas que provocan anualmente inundaciones que causan cuantiosas pérdidas materiales, económicas y vidas humanas. Se presenta un estudio de análisis regional de frecuencia de precipitaciones máximas basado en el método del índice de avenida con sus parámetros estimados por los L-momentos. Se ha contado con un total de 12 estaciones pluviométricas con registros de observaciones de más de 20 años. Las medidas de discordancia y heterogeneidad basadas en los L-momentos revelaron que la región de estudio puede ser considerada homogénea. De entre las funciones de distribución candidatas analizadas las simulaciones de Monte Carlo identificaron la función de distribución Logística Generalizada como la de mejor ajuste a escala regional. Los resultados obtenidos pueden ser de utilidad en estudios relacionados con las avenidas y delimitación de zonas inundables de la región | es_ES |
| dc.description.sponsorship | Los autores desean expresar su agradecimiento a la Xunta de Galicia y Cooperación Galega por la financiación de este estudio que ha sido realizado en el marco del proyecto: “Análise de mapas de inundação e redução de desastres nas bacias internas de Cabo Delgado. Caracterização e fortalecimento institucional em ARA-Norte”. Asimismo agradecen la colaboración prestada por los técnicos del Departamento Técnico de la Administración Regional de Aguas del Norte de Mozambique (ARA-Norte). | |
| dc.language | Español | es_ES |
| dc.publisher | Universitat Politècnica de València | |
| dc.relation.ispartof | Ingeniería del Agua | |
| dc.rights | Reconocimiento - No comercial - Sin obra derivada (by-nc-nd) | es_ES |
| dc.subject | Regional frequency analysis | es_ES |
| dc.subject | L-moments | es_ES |
| dc.subject | Index flood | es_ES |
| dc.subject | Análisis regional de frecuencia | es_ES |
| dc.subject | Índice de avenida | es_ES |
| dc.subject | L-momentos | es_ES |
| dc.subject | Inundaciones | es_ES |
| dc.title | Análisis regional de frecuencia de precipitaciones extremas en el Norte de Mozambique | es_ES |
| dc.title.alternative | Regional frequency analysis of extremes precipitations in Northern of Mozambique | es_ES |
| dc.type | Artículo | es_ES |
| dc.date.updated | 2017-01-20T12:21:45Z | |
| dc.identifier.doi | 10.4995/ia.2016.4176 | |
| dc.rights.accessRights | Abierto | es_ES |
| dc.description.bibliographicCitation | Álvarez, M.; Puertas, J.; Peña, E. (2016). Análisis regional de frecuencia de precipitaciones extremas en el Norte de Mozambique. Ingeniería del Agua. 20(1):28-42. https://doi.org/10.4995/ia.2016.4176 | es_ES |
| dc.description.accrualMethod | SWORD | es_ES |
| dc.relation.publisherversion | https://doi.org/10.4995/ia.2016.4176 | es_ES |
| dc.description.upvformatpinicio | 28 | es_ES |
| dc.description.upvformatpfin | 42 | es_ES |
| dc.type.version | info:eu-repo/semantics/publishedVersion | es_ES |
| dc.description.volume | 20 | |
| dc.description.issue | 1 | |
| dc.identifier.eissn | 1886-4996 | |
| dc.contributor.funder | Xunta de Galicia | es_ES |
| dc.description.references | Chiew, F.H., Siriwardena, L. (2005). Trend/Change detection software. USER GUIDE. CRC for Catchment Hydrology, Australia. | es_ES |
| dc.description.references | Dalrymple, T. (1960). Flood frequency analysis. USGS Water Supply Paper 1543-A. | es_ES |
| dc.description.references | Fisz, M. (1963). Probability Theory and Mathematical Statistics. John Wiley, New York. | es_ES |
| dc.description.references | Grayson, R.B., Argent R.M., Nathan, R.J., McMahon, T.A., Mein, R. (1996). Hydrological Recipes: Estimation Techniques in Australian | es_ES |
| dc.description.references | Hydrology. Cooperative Research Centre for Catchment Hydrology, Australia. | es_ES |
| dc.description.references | Greenwood, J.A., Landwehr, J.M., Matalas, N.C., Wallis, J.R. (1979). Probability weighted moments: definition and relation to parameters of several distributions expressible in inverse form. Water Resources Research, 15(5), 1049-1054. doi:10.1029/WR015i005p01049 | es_ES |
| dc.description.references | Gumbel, E.J. (1958). Statistics of extremes. Columbia University Press, New York. | es_ES |
| dc.description.references | Guttman, N.B. (1993). The use of L-moments in the determination of regional precipitation climates. Journal of Climate, 6, 2309-2325. doi:10.1175/1520-0442(1993)006<2309:TUOLMI>2.0.CO;2 | es_ES |
| dc.description.references | Guttman, N. B., Hosking, J. R., Wallis, J. R. (1997). Regional precipitation quantile values for the continental U.S. computed from L-moments. Journal of Climate, 6, 2326-2340. doi:10.1175/1520-0442(1993)006<2326:RPQVFT>2.0.CO;2 | es_ES |
| dc.description.references | Hirsch, R.M., Slack, J.R., Smith, R.A. (1982). Techniques of trend analysis for monthly water quality data. Water Resources. Research, 18(1), 107-121. doi:10.1029/WR018i001p00107 | es_ES |
| dc.description.references | Hosking, J. R. (1986). The theory of probability weighted moments. Research Report RC 12210, IBM Research Division. Yorktown Heights, NY. | es_ES |
| dc.description.references | Hosking, J.R. (1988). The four-parameter kappa distribution. Research Report RC 13412, IBM Research Division, Yorktown Heights, NY. | es_ES |
| dc.description.references | Hosking, J. R. (1990). L-moments: Analysis and Estimation of Distributions using Linear Combinations of order Statistics. Journal of Royal Statistical Society, 52(1), 105-124. | es_ES |
| dc.description.references | Hosking, J.R. (1994). The four-parameter kappa distribution. IBM Journal of Research and Development,38(3), 251-258. doi:10.1147/rd.383.0251 | es_ES |
| dc.description.references | Hosking, J.R., Wallis, J.R. (1997). Regional frequency analysis: an approach based on L-moments. Cambridge University Press. doi:10.1017/cbo9780511529443 | es_ES |
| dc.description.references | Hosking, J.R. (2014a). Regional frequency analysis using L-moments. R package: lmomRFA, versión 3.0: July, 2, 2014. (http://cran.r-project.org/web/packages/lmomRFA/index.html). | es_ES |
| dc.description.references | Hosking, J.R. (2014b). L-moments. R package: lmom, versión 2.4: July, 2, 2014. (http://cran.r-project.org/web/packages/lmom/index.html) | es_ES |
| dc.description.references | Jenkinson, A.F. (1955). The Frequency Distribution of the Annual Maximum (or Minimum) Values of Meteorological Elements. Quaterly Journal of the Royal Meteorological Society, 87, 158. doi:10.1002/qj.49708134804 | es_ES |
| dc.description.references | Jenkins, G.M., Watts, D.G. (1968). Spectral analysis and its applications. Holden-Day, San Francisco, California. | es_ES |
| dc.description.references | Kendall, M.G. (1975). Rank Correlation Methods. 4th Edn., Charles Griffin, London. | es_ES |
| dc.description.references | Kundzewicz, Z.W., Robson, A. (2000). Detecting Trend and Other Changes in Hydrological Data. World Climate Program - Water, WMO/UNESCO, WCDMP-45, WMO/TD 1013, Geneva. | es_ES |
| dc.description.references | Madsen, H., Pearson, C.P., Rosbjerg, D. (1997). Comparison of annual maximum series and partial duration series methods for modeling extreme hydrologic events 2. Regional modeling. Water Resources Research, 33(4), 759-769. doi:10.1029/96WR03849 | es_ES |
| dc.description.references | Mann, H.B. (1945). Non-parametric test against trend. Econometrica, 13(3), 245-259. doi:10.2307/1907187 | es_ES |
| dc.description.references | Meacham, I. (1968). Correlation in sequential data three sample indicators. Civil Eng. Trans. Inst. Eng. Aust., 10, 225-228 | es_ES |
| dc.description.references | Norbiato, D., Borga, M., Sangati, M., Zanon, F. (2007). Regional frequency analysis of extreme precipitation in the eastern Italian Alps and the August 29, 2003 flash flood. Journal of Hydrology, 345(3-4), 149-166. doi:10.1016/j.jhydrol.2007.07.009 | es_ES |
| dc.description.references | Ngongondo, C.N., Chong-Yu, X., Lena, M.T., Berhanu, A., Tobias, C. (2011). Regional frequency analysis of rainfall extremes in Southern Malawi using the index rainfall and L-moments approaches. Stochastic Environmental Research and Risk Assessment, 25(7), 939-955. doi:10.1007/s00477-011-0480-x | es_ES |
| dc.description.references | Organización Meteorológica Mundial, (1994). Guía de prácticas hidrológicas. Quinta edición, OMM-Nº 168, Ginebra. | es_ES |
| dc.description.references | Parida, B.P., Moalafhi, D.B. (2008) Regional rainfall frequency analysis for Botswana using L-Moments and radial basis function network. Physics and Chemistry of the Earth, 33(8-13), 614-620. doi:10.1016/j.pce.2008.06.011 | es_ES |
| dc.description.references | Pearson, C.P., McKerchar, A.I., Woods, R.A. (1991). Regional flood frequency análisis of western Australian data using L-moments. International Hydrology and Water Resources Symposium, Perth, Australia, 631-632. | es_ES |
| dc.description.references | Siegel S., Castellan N.J. (1988). Non-parametric Statistics for the Behavioural Sciences. McGraw-Hill, New York, USA. | es_ES |
| dc.description.references | Smithers, J.C., Schulze, R.E. (2001). A methodology for the estimation of short duration design storms in South Africa using a regional approach based on L-moments. Journal of Hydrology, 241(1-2), 41-52. doi:10.1016/S0022-1694(00)00374-7 | es_ES |
| dc.description.references | Student, (1908). The probable error of a mean. Biometrika,6(1), 1-25. doi:10.1093/biomet/6.1.1 | es_ES |
| dc.description.references | Vogel, R.M., Fennessey, N.M., 1993. L-moment diagrams should replace product moment diagrams. Water Resources Research,29(6), 1745-1754). doi:10.1029/93WR00341 | es_ES |
| dc.description.references | Vogel, R.M., Thomas, W.O., McMahon, T.A. (1993). Flood-flow frequency model selection in southwestern United States. Journal of Water Resources Planning and Management, 119(3), 353-366. doi:10.1061/(ASCE)0733-9496(1993)119:3(353) | es_ES |


