


Automatic Measurement of Magnetron Rieke Diagrams
RiuNet: Repositorio Institucional de la Universidad Politécnica de Valencia
JavaScript is disabled for your browser. Some features of this site may not work without it.
Buscar en RiuNet
Listar
Mi cuenta
Estadísticas
Ayuda RiuNet
Admin. UPV


Automatic Measurement of Magnetron Rieke Diagrams
Mostrar el registro sencillo del ítem
Ficheros en el ítem
| dc.contributor.author | Bilik, Vladimir
|
es_ES |
| dc.date.accessioned | 2019-11-05T07:31:15Z | |
| dc.date.available | 2019-11-05T07:31:15Z | |
| dc.date.issued | 2019-10-15 | |
| dc.identifier.isbn | 9788490487198 | |
| dc.identifier.uri | http://hdl.handle.net/10251/130217 | |
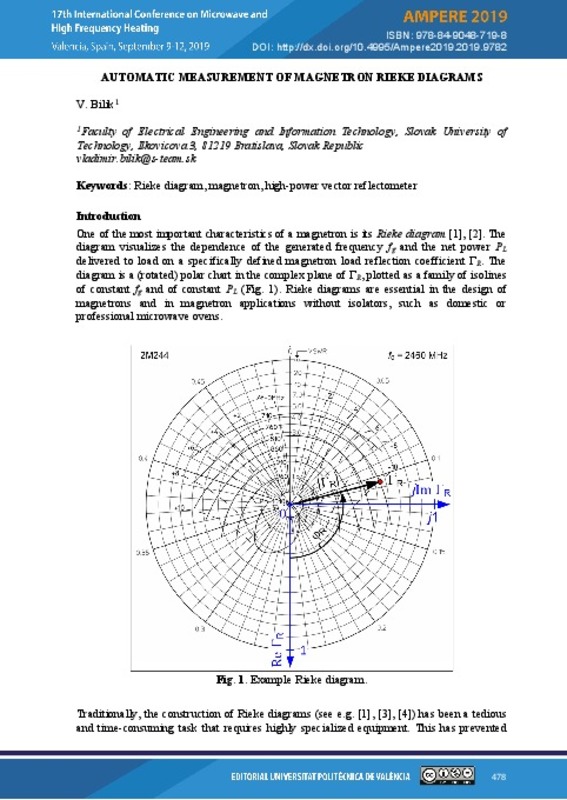
| dc.description.abstract | [EN] A Rieke diagram [1] is a magnetron characteristic that visualizes the dependence of the generated frequency fg and the net delivered power PL on the load reflection coefficient GR. GR is defined in a specific magnetron-to-waveguide coupling structure called the standard or reference launcher (Fig. 1). The diagram is plotted as a family of isolines of constant fg and of constant PL in the polar diagram of GR. Rieke diagrams are essential in the design of applications without isolators, such as domestic or professional microwave ovens. Constructing Rieke diagrams is tedious, time-consuming and equipment-demanding [2], [3], preventing systematic studies of their dependence on operating conditions, such as anode voltage and its ripple, filament current, mounting repeatability, etc. We have devised a procedure, centering around a high-power automatic impedance matching device (autotuner), which enables fully automatic measurement and plotting of the stated dependences. A block diagram of the setup is shown in Fig. 1. The autotuner, when terminated in a match (waterload), can accomplish a task inverse to impedance matching: realizing any desired reflection coefficient GR. The measurement consists of stepping through a grid of n suitably chosen reflection coefficients GR = xR + jyR, covering a desired area of the polar diagram. Each GR is measured accurately by the autotuner, along with the corresponding fg and PL. Thus, raw data for constructing a Rieke diagram are obtained, the data consisting of a collection of n points {GR, fg, PL}i, i = 1…n, with GR, in general, irregularly scattered in the complex plane. A dedicated MATLAB routine then reads the data, sorts them out to create tabulated functions fg = f(xR, yR), PL = f(xR, yR), approximates these by a 2D spline, and uses the splines to plot smoothed isocontours for chosen constant values of fg and PL, completing thus the desired Rieke diagram construction. We will present details of this procedure as well as real-life examples. Fig. 1. Rieke diagram measurement setup. | es_ES |
| dc.format.extent | 9 | es_ES |
| dc.language | Inglés | es_ES |
| dc.publisher | Editorial Universitat Politècnica de València | es_ES |
| dc.relation.ispartof | AMPERE 2019. 17th International Conference on Microwave and High Frequency Heating | es_ES |
| dc.rights | Reconocimiento - No comercial - Sin obra derivada (by-nc-nd) | es_ES |
| dc.subject | Energy Production by Microwaves | es_ES |
| dc.subject | Microwave CVD | es_ES |
| dc.subject | EM Modelling | es_ES |
| dc.subject | Microwave Material interaction | es_ES |
| dc.subject | Dielectric Properties | es_ES |
| dc.subject | Dielectric Properties Measurement | es_ES |
| dc.subject | Solid State Microwave | es_ES |
| dc.subject | Microwave Processing | es_ES |
| dc.subject | Microwave Chemistry | es_ES |
| dc.subject | Microwave applicators design | es_ES |
| dc.subject | Rieke diagram | es_ES |
| dc.subject | Magnetron | es_ES |
| dc.subject | High-power vector reflectometer | es_ES |
| dc.title | Automatic Measurement of Magnetron Rieke Diagrams | es_ES |
| dc.type | Capítulo de libro | es_ES |
| dc.type | Comunicación en congreso | es_ES |
| dc.identifier.doi | 10.4995/AMPERE2019.2019.9782 | |
| dc.rights.accessRights | Abierto | es_ES |
| dc.description.bibliographicCitation | Bilik, V. (2019). Automatic Measurement of Magnetron Rieke Diagrams. En AMPERE 2019. 17th International Conference on Microwave and High Frequency Heating. Editorial Universitat Politècnica de València. 478-486. https://doi.org/10.4995/AMPERE2019.2019.9782 | es_ES |
| dc.description.accrualMethod | OCS | es_ES |
| dc.relation.conferencename | Ampere 2019 | es_ES |
| dc.relation.conferencedate | Septiembre 09-12, 2019 | es_ES |
| dc.relation.conferenceplace | Valencia, Spain | es_ES |
| dc.relation.publisherversion | http://ocs.editorial.upv.es/index.php/AMPERE2019/AMPERE2019/paper/view/9782 | es_ES |
| dc.description.upvformatpinicio | 478 | es_ES |
| dc.description.upvformatpfin | 486 | es_ES |
| dc.type.version | info:eu-repo/semantics/publishedVersion | es_ES |
| dc.relation.pasarela | OCS\9782 | es_ES |
Este ítem aparece en la(s) siguiente(s) colección(ones)
-
Ampere 2019 [66]
Ítems relacionados
Mostrando ítems relacionados por Título, Autor, Creador y Palabras clave.

Universitat Politècnica de València. Unidad de Documentación Científica de la Biblioteca (+34) 96 387 70 85 · RiuNet@bib.upv.es
El contenido de este sitio está bajo una licencia Creative Commons Reconocimiento – No Comercial – Sin Obra Derivada (by-nc-nd), salvo que se indique lo contrario.
Los metadatos de este sitio están bajo una licencia Dominio Público.
