JavaScript is disabled for your browser. Some features of this site may not work without it.
Buscar en RiuNet
Listar
Mi cuenta
Estadísticas
Ayuda RiuNet
Admin. UPV
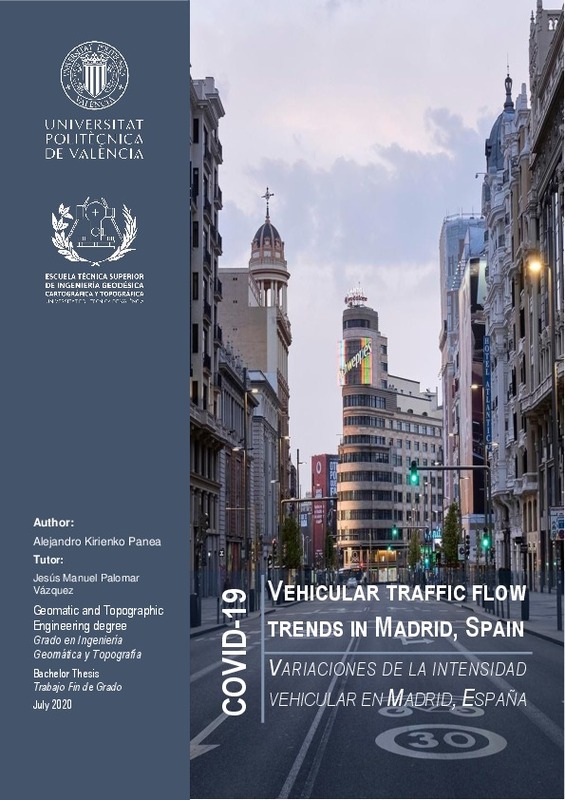
COVID-19 Vehicular traffic flow trends in Madrid (Spain)
Mostrar el registro completo del ítem
Kirienko Panea, A. (2020). COVID-19 Vehicular traffic flow trends in Madrid (Spain). Universitat Politècnica de València. http://hdl.handle.net/10251/149274
Por favor, use este identificador para citar o enlazar este ítem: http://hdl.handle.net/10251/149274
Ficheros en el ítem
Metadatos del ítem
| Título: | COVID-19 Vehicular traffic flow trends in Madrid (Spain) | |||
| Otro titulo: |
|
|||
| Autor: | Kirienko Panea, Alejandro | |||
| Director(es): | ||||
| Entidad UPV: |
|
|||
| Fecha acto/lectura: |
|
|||
| Resumen: |
[EN] Comparative analysis of the evolution of the evolution of traffic intensity in Madrid from the end of 2019, before the coronavirus outbreak, until the eve of phase 2 of the de-escalation after the declaration of the ...[+]
[ES] Análisis comparativo de la evolución de la evolución de la intensidad de tráfico en Madrid desde finales de 2019, antes del brote de coronavirus, hasta la víspera de la fase 2 de la desescalada tras la declaración del ...[+]
|
|||
| Palabras clave: |
|
|||
| Derechos de uso: | Reserva de todos los derechos | |||
| Editorial: |
|
|||
| Titulación: |
|
|||
| Tipo: |
|
Localización
recommendations
Este ítem aparece en la(s) siguiente(s) colección(ones)
-
Colección especial COVID-19 [250]
-
ETSIGCT - Trabajos académicos [494]
Escuela Técnica Superior de Ingeniería Geodésica, Cartográfica y Topográfica


![ZIP archive [ZIP]](/themes/UPV/images/zip.png)


