|
Resumen:
|
[EN] The use of diagrams is a graphic strategy, which, given the need to establish interpretative mechanisms that help us appreciate how a structure of such great formal complexity operates, has been used for some time to ...[+]
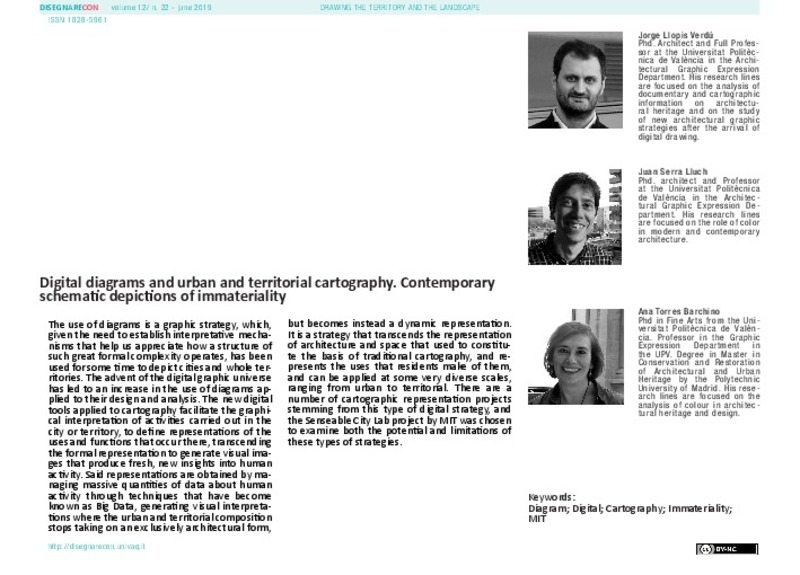
[EN] The use of diagrams is a graphic strategy, which, given the need to establish interpretative mechanisms that help us appreciate how a structure of such great formal complexity operates, has been used for some time to depict cities and whole territories. The advent of the digital graphic universe has led to an increase in the use of diagrams applied to their design and analysis. The new digital tools applied to cartography facilitate the graphical interpretation of activities carried out in the city or territory, to define representations of the uses and functions that occur there, transcending the formal representation to generate visual images that produce fresh, new insights into human activity. Said representations are obtained by managing massive quantities of data about human activity through techniques that have become known as Big Data, generating visual interpretations where the urban and territorial composition stops taking on an exclusively architectural form, but becomes instead a dynamic representation. It is a strategy that transcends the representation of architecture and space that used to constitute the basis of traditional cartography, and represents the uses that residents make of them, and can be applied at some very diverse scales, ranging from urban to territorial. There are a number of cartographic representation projects stemming from this type of digital strategy, and the Senseable City Lab project by MIT was chosen to examine both the potential and limitations of these types of strategies.
[-]
[ES] El empleo de diagramas es una estrategia gráfica que desde hace mucho tiempo ha permitido representar la ciudad y el territorio, dada la necesidad de establecer mecanismos interpretativos que permitan comprender el ...[+]
[ES] El empleo de diagramas es una estrategia gráfica que desde hace mucho tiempo ha permitido representar la ciudad y el territorio, dada la necesidad de establecer mecanismos interpretativos que permitan comprender el funcionamiento de una estructura de gran complejidad formal. El advenimiento del universo gráfico digital ha conllevado un auge del diagrama aplicado al diseño y al análisis de la ciudad y del territorio. Las nuevas herramientas digitales aplicadas a la cartografía posibilitan la interpretación gráfica de las actividades desarrolladas en la ciudad y en el territorio, para definir representaciones de los usos y funciones que se desarrollan en los mismos, trascendiendo la representación formal para generar imágenes visuales que producen visiones novedosas de los procesos humanos. Se trata de representaciones obtenidas a partir de la gestión de cantidades masivas de datos relativos a la actividad humana a través de técnicas de lo que ha dado en denominarse Big Data, generándose interpretaciones visuales en las que la forma urbana y territorial deja de ser exclusivamente forma arquitectónica para constituirse en representaciones dinámicas. Es una estrategia que trasciende la representación de arquitecturas y espacios que constituía la base de la cartografía tradicional, para representar los usos que los residentes hacen de los mismos, aplicándolas a escalas muy diversas que oscilan entre lo urbano y lo territorial. Son múltiples los proyectos de representación cartográfica derivadas de este tipo de estrategias digitales, entre las que se ha elegido el proyecto Senseable City Lab del MIT para profundizar en el potencial y los límites de este tipo de estrategias.
[-]
|


