JavaScript is disabled for your browser. Some features of this site may not work without it.
Buscar en RiuNet
Listar
Mi cuenta
Estadísticas
Ayuda RiuNet
Admin. UPV
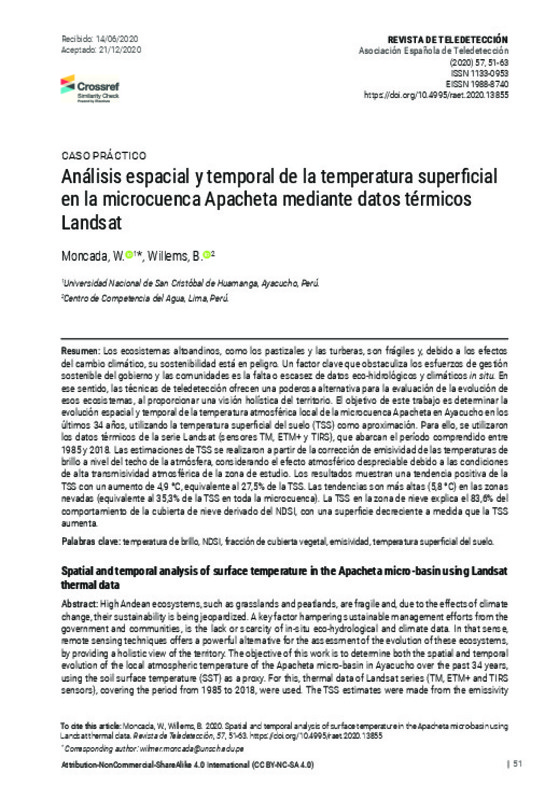
Análisis espacial y temporal de la temperatura superficial en la microcuenca Apacheta mediante datos térmicos Landsat
Mostrar el registro sencillo del ítem
Ficheros en el ítem
| dc.contributor.author | Moncada, W.
|
es_ES |
| dc.contributor.author | Willems, B.
|
es_ES |
| dc.coverage.spatial | east=-74.22975110745647; north=-13.177198104516764; name=Ayacucho 05003, Perú | es_ES |
| dc.date.accessioned | 2021-01-20T14:04:54Z | |
| dc.date.available | 2021-01-20T14:04:54Z | |
| dc.date.issued | 2020-12-28 | |
| dc.identifier.issn | 1133-0953 | |
| dc.identifier.uri | http://hdl.handle.net/10251/159575 | |
| dc.description.abstract | [EN] High Andean ecosystems, such as grasslands and peatlands, are fragile and, due to the effects of climate change, their sustainability is being jeopardized. A key factor hampering sustainable management efforts from the government and communities, is the lack or scarcity of in-situ eco-hydrological and climate data. In that sense, remote sensing techniques offers a powerful alternative for the assessment of the evolution of these ecosystems, by providing a holistic view of the territory. The objective of this work is to determine both the spatial and temporal evolution of the local atmospheric temperature of the Apacheta micro-basin in Ayacucho over the past 34 years, using the soil surface temperature (SST) as a proxy. For this, thermal data of Landsat series (TM, ETM+ and TIRS sensors), covering the period from 1985 to 2018, were used. The TSS estimates were made from the emissivity correction of the brightness temperatures at the top of the atmosphere, considering the negligible atmospheric effect due to the conditions of high atmospheric transmissivity in the study area. The results show a positive trend of the SST with an increase of 4.9 °C, equivalent to 27.5% of the SST. Trends are higher (5.8 °C) in the snowy areas (equivalent to 35.3% of the TSS in the whole micro-basin). The SST in the snow area explains the 83.6% of the behavior of the snow cover derived by the NDSI, with a decreasing surface as SST increase. | es_ES |
| dc.description.abstract | [ES] Los ecosistemas altoandinos, como los pastizales y las turberas, son frágiles y, debido a los efectos del cambio climático, su sostenibilidad está en peligro. Un factor clave que obstaculiza los esfuerzos de gestión sostenible del gobierno y las comunidades es la falta o escasez de datos eco-hidrológicos y climáticos in situ. En ese sentido, las técnicas de teledetección ofrecen una poderosa alternativa para la evaluación de la evolución de esos ecosistemas, al proporcionar una visión holística del territorio. El objetivo de este trabajo es determinar la evolución espacial y temporal de la temperatura atmosférica local de la microcuenca Apacheta en Ayacucho en los últimos 34 años, utilizando la temperatura superficial del suelo (TSS) como aproximación. Para ello, se utilizaron los datos térmicos de la serie Landsat (sensores TM, ETM+ y TIRS), que abarcan el período comprendido entre 1985 y 2018. Las estimaciones de TSS se realizaron a partir de la corrección de emisividad de las temperaturas de brillo a nivel del techo de la atmósfera, considerando el efecto atmosférico despreciable debido a las condiciones de alta transmisividad atmosférica de la zona de estudio. Los resultados muestran una tendencia positiva de la TSS con un aumento de 4,9 °C, equivalente al 27,5% de la TSS. Las tendencias son más altas (5,8 °C) en las zonas nevadas (equivalente al 35,3% de la TSS en toda la microcuenca). La TSS en la zona de nieve explica el 83,6% del comportamiento de la cubierta de nieve derivado del NDSI, con una superficie decreciente a medida que la TSS aumenta. | es_ES |
| dc.description.sponsorship | Este trabajo ha sido posible gracias al apoyo financiero de los proyectos “Strengthening resilience of Andean river basin headwaters facing global change” (PGA_084063) y “Agua-Andes: Ecological infrastructure strategies for enhancing water sustainability in the semi-arid Andes” financiados por el Programa PEER de USAID, y el proyecto “International Water Security Network”, financiado por el Lloyd’s Register Foundation. Los autores agradecen a la Universidad Nacional de San Cristóbal de Huamanga por su incondicional apoyo. | es_ES |
| dc.language | Español | es_ES |
| dc.publisher | Universitat Politècnica de València | es_ES |
| dc.relation.ispartof | Revista de Teledetección | es_ES |
| dc.rights | Reconocimiento - No comercial - Compartir igual (by-nc-sa) | es_ES |
| dc.subject | Brightness temperature | es_ES |
| dc.subject | NDSI | es_ES |
| dc.subject | Vegetation cover fraction | es_ES |
| dc.subject | Emissivity | es_ES |
| dc.subject | Soil surface temperature | es_ES |
| dc.subject | Temperatura de brillo | es_ES |
| dc.subject | Fracción de cubierta vegetal | es_ES |
| dc.subject | Emisividad | es_ES |
| dc.subject | Temperatura superficial del suelo | es_ES |
| dc.title | Análisis espacial y temporal de la temperatura superficial en la microcuenca Apacheta mediante datos térmicos Landsat | es_ES |
| dc.title.alternative | Spatial and temporal analysis of surface temperature in the Apacheta micro-basin using Landsat thermal data | es_ES |
| dc.type | Artículo | es_ES |
| dc.identifier.doi | 10.4995/raet.2020.13855 | |
| dc.rights.accessRights | Abierto | es_ES |
| dc.description.bibliographicCitation | Moncada, W.; Willems, B. (2020). Análisis espacial y temporal de la temperatura superficial en la microcuenca Apacheta mediante datos térmicos Landsat. Revista de Teledetección. 0(57):51-63. https://doi.org/10.4995/raet.2020.13855 | es_ES |
| dc.description.accrualMethod | OJS | es_ES |
| dc.relation.publisherversion | https://doi.org/10.4995/raet.2020.13855 | es_ES |
| dc.description.upvformatpinicio | 51 | es_ES |
| dc.description.upvformatpfin | 63 | es_ES |
| dc.type.version | info:eu-repo/semantics/publishedVersion | es_ES |
| dc.description.volume | 0 | es_ES |
| dc.description.issue | 57 | es_ES |
| dc.identifier.eissn | 1988-8740 | |
| dc.relation.pasarela | OJS\13855 | es_ES |
| dc.description.references | Aguilar, H., Mora, R., Vargas, C. 2014. Metodología para la corrección atmosférica de imágenes Aster, Rapideye, Spot 2 y Landsat 8 con el módulo Flaash del software Envi. Revista Geográfica de América Central, 2(53), 39-59. https://doi.org/10.15359/rgac.2-53.2 | es_ES |
| dc.description.references | Aguilar, J., Espinoza, R., Espinoza, J.C., Rojas, J., Willems, B.L., Leyva, W.M. 2019. Elevationdependent warming of land surface temperatures in the Andes assessed using MODIS LST time series (2000-2017). International Journal of Applied Earth Observation and Geoinformation, 77, 119- 128. https://doi.org/10.1016/j.jag.2018.12.013 | es_ES |
| dc.description.references | Araghi, A., Mousavi-Baygi, M., Adamowski, J. 2017. Detecting soil temperature trends in Northeast Iran from 1993 to 2016. Soil and Tillage Research, 174, 177-192. https://doi.org/10.1016/j.still.2017.07.010 | es_ES |
| dc.description.references | Artis, D. A., Carnahan, W.H. 1982. Survey of emissivity variability in thermography of urban areas. Remote Sensing of Environment, 12(4), 313-329. https://doi.org/10.1016/0034-4257(82)90043-8 | es_ES |
| dc.description.references | Arvidson, T., Barsi, J., Jhabvala, M., Reuter, D. 2013. Landsat and Thermal Infrared Imaging. En C. Kuenzer & S. Dech (Eds.), Thermal Infrared Remote Sensing: Sensors, Methods, Applications (pp. 177-196). Springer Netherlands. https://doi.org/10.1007/978-94-007-6639-6_9 | es_ES |
| dc.description.references | Avdan, U., Jovanovska, G. 2016. Algorithm for Automated Mapping of Land Surface Temperature Using Landsat 8 Satellite Data. Journal of Sensors, 2016, 1480307-1480307. https://doi.org/10.1155/2016/1480307 | es_ES |
| dc.description.references | Carlson, T.N., Ripley, D.A. 1997. On the relation between NDVI, fractional vegetation cover, and leaf area index. Remote Sensing of Environment, 62(3), 241-252. https://doi.org/10.1016/S0034-4257(97)00104-1 | es_ES |
| dc.description.references | Caselles, E., Abad, F.J., Valor, E., Caselles, V. 2011. Automatic Generation of Land Surface Emissivity Maps. Climate Change - Research and Technology for Adaptation and Mitigation, 15. https://doi.org/10.5772/24968 | es_ES |
| dc.description.references | Chi, Y., Sun, J., Sun, Y., Liu, S., Fu, Z. 2020. Multitemporal characterization of land surface temperature and its relationships with normalized difference vegetation index and soil moisture content in the Yellow River Delta, China. Global Ecology and Conservation, 23, e01092. https://doi.org/10.1016/j.gecco.2020.e01092 | es_ES |
| dc.description.references | Dozier, J. 1989. Spectral signature of alpine snow cover from the Landsat thematic mapper. Remote Sensing of Environment, 28, 9-22. https://doi.org/10.1016/0034-4257(89)90101-6 | es_ES |
| dc.description.references | Gutman, G., Ignatov, A. 1998. The derivation of the green vegetation fraction from NOAA/AVHRR data for use in numerical weather prediction models. International Journal of Remote Sensing, 19(8), 1533- 1543. https://doi.org/10.1080/014311698215333 | es_ES |
| dc.description.references | Huete, A., Didan, K., Miura, T., Rodriguez, E.P., Gao, X., Ferreira, L.G. 2002. Overview of the radiometric and biophysical performance of the MODIS vegetation indices. Remote Sensing of Environment, 83(1), 195-213. https://doi.org/10.1016/S0034-4257(02)00096-2 | es_ES |
| dc.description.references | ITT Visual Information Solutions. 2009. ENVI Atmospheric Correction Module: QUAC and FLAASH User's Guide, Version 4.7, pp. 44. http://www.harrisgeospatial.com/portals/0/pdfs/ envi/Flaash_Module.pdf | es_ES |
| dc.description.references | Jiménez-Muñoz, J.C., Sobrino, J.A., Skoković, D., Mattar, C., Cristóbal, J. 2014. Land Surface Temperature Retrieval Methods From Landsat-8 Thermal Infrared Sensor Data. IEEE Geoscience and Remote Sensing Letters, 11(10), 1840-1843. https://doi.org/10.1109/LGRS.2014.2312032 | es_ES |
| dc.description.references | Mendoza, J.N. 2014. Implementación de un método operativo para la estimación de la temperatura superficial terrestre en la Región Callao usando datos de las imágenes satelitales. Universidad Nacional del Callao, 53. http://repositorio.unac.edu.pe/handle/UNAC/966 | es_ES |
| dc.description.references | Moncada, W., Pereda, A., Aldana, C., Masias, M., Jiménez, J. 2015. Cuantificación hidrográfica de la cuenca del río Cachi-Ayacucho, mediante imágenes satelitales. Instituto de Investigación Científica e innovación Tecnológica de la UNSCH, II. | es_ES |
| dc.description.references | Moncada, W., Willems, B., Rojas, J. 2020. Estimación de estadíos estacionales a partir de parámetros climáticos medidos en la estación meteorológica de la microcuenca Apacheta, Región Ayacucho, 2000 al 2018. Revista de Investigación de Física. UNMSM, 23(2), 17-25. https://fisica.unmsm.edu.pe/ rif/previo_files/2020-2/03moncada.pdf | es_ES |
| dc.description.references | Pereda, A., Moncada, W., Verde, L. 2018. Respuesta nival de la cabecera de cuenca Cachi-Apacheta de Ayacucho: Vol. I. Editorial Académica Española. https://www.morebooks.shop/store/es/book/ respuesta-nival-de-la-cabecera-de-cuenca-cachiapacheta-de-ayacucho/isbn/978-620-2-12620-5 | es_ES |
| dc.description.references | Quispe, B.J., Révolo, R.H. 2020. Temperatura superficial y estado de la vegetación del bosque de Polylepis spp, distrito de San Marcos de Rocchac, Huancavelica - Perú. Enfoque UTE, 11(3), 69-86. https://doi.org/10.29019/enfoque.v11n3.592 | es_ES |
| dc.description.references | Rudjord, Due, 2012. Evaluation of FLAASH atmospheric correction (SAMBA/10/12; p. 24). Norwegian Computing Center. http://publications. nr.no/1338298623/Rudjord-Trier_FLAASH_2012. pdf | es_ES |
| dc.description.references | Santos, B. 2016. Cubierta Nival y Temperaturas de Superficie en Sierra Nevada a través del tratamiento digital de imágenes de satélite [Tesis Doctoral, Universitat de Barcelona]. http://diposit.ub.edu/dspace/handle/2445/108441 | es_ES |
| dc.description.references | Sayão, V.M., Demattê, J.A.M., Bedin, L.G., Nanni, M.R., Rizzo, R. 2018. Satellite land surface temperature and reflectance related with soil attributes. Geoderma, 325, 125-140. https://doi.org/10.1016/j.geoderma.2018.03.026 | es_ES |
| dc.description.references | Sobrino, J., Jiménez, J., Paolini, L. 2004. Land surface temperature retrieval from Landsat TM 5. Remote Sensing of Environment, 90(4), 434-440. https://doi.org/10.1016/j.rse.2004.02.003 | es_ES |
| dc.description.references | Solman, S.A., Nuñez, M.N., Cabré, M.F. 2008. Regional climate change experiments over southern South America. I: Present climate. Climate Dynamics, 30(5), 533-552. https://doi.org/10.1007/s00382-007-0304-3 | es_ES |
| dc.description.references | USGS, Landsat Collections, Landsat Missions. Consultado el 14 de octubre de 2019, de https://www.usgs.gov/land-resources/nli/landsat. | es_ES |
| dc.description.references | Vuille, M., Bradley, R.S. 2000. Mean annual temperature trends and their vertical structure in the tropical Andes. Geophysical Research Letters, 27(23), 3885- 3888. https://doi.org/10.1029/2000GL011871 | es_ES |
| dc.description.references | Weng, Q., Lu, D., Schubring, J. 2004. Estimation of land surface temperature-vegetation abundance relationship for urban heat island studies. Remote Sensing of Environment, 89(4), 467-483. https://doi.org/10.1016/j.rse.2003.11.005 | es_ES |
| dc.description.references | Xu, C., Qu, J.J., Hao, X., Zhu, Z., Gutenberg, L. 2020. Surface soil temperature seasonal variation estimation in a forested area using combined satellite observations and in-situ measurements. International Journal of Applied Earth Observation and Geoinformation, 91, 102156. https://doi.org/10.1016/j.jag.2020.102156 | es_ES |
| dc.description.references | Zhang, A., Liu, X., Di, W. 2009. Derivation of the green vegetation fraction from TM data of three gorges area. Procedia Earth and Planetary Science, 1(1), 1152- 1157. https://doi.org/10.1016/j.proeps.2009.09.177 | es_ES |


