JavaScript is disabled for your browser. Some features of this site may not work without it.
Buscar en RiuNet
Listar
Mi cuenta
Estadísticas
Ayuda RiuNet
Admin. UPV
Modelación de °Brix y pH en uva vinífera mediante imágenes satelitales. Valle de Colchagua, Chile
Mostrar el registro sencillo del ítem
Ficheros en el ítem
| dc.contributor.author | Fredes, Sandra
|
es_ES |
| dc.contributor.author | Ruiz Fernández, Luis Ángel
|
es_ES |
| dc.contributor.author | Recio Recio, Jorge Abel
|
es_ES |
| dc.coverage.spatial | east=-71.097317; north=-34.6761419; name=Colchagua, Xile | es_ES |
| dc.date.accessioned | 2021-10-14T07:34:29Z | |
| dc.date.available | 2021-10-14T07:34:29Z | |
| dc.date.issued | 2021-10-01 | |
| dc.identifier.isbn | 9788490489611 | |
| dc.identifier.uri | http://hdl.handle.net/10251/174665 | |
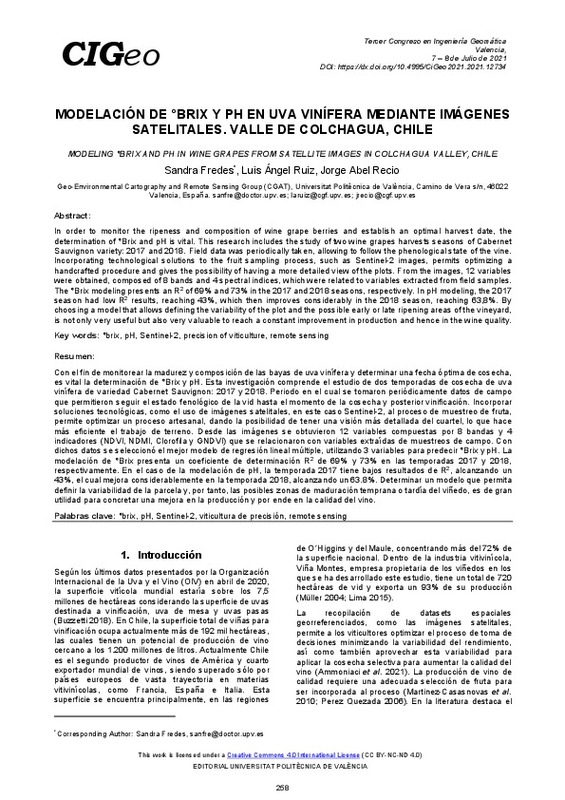
| dc.description.abstract | [EN] In order to monitor the ripeness and composition of wine grape berries and establish an optimal harvest date, the determination of °Brix and pH is vital. This research includes the study of two wine grapes harvests seasons of Cabernet Sauvignon variety: 2017 and 2018. Field data was periodically taken, allowing to follow the phenological state of the vine. Incorporating technological solutions to the fruit sampling process, such as Sentinel-2 images, permits optimizing a handcrafted procedure and gives the possibility of having a more detailed view of the plots. From the images, 12 variables were obtained, composed of 8 bands and 4 spectral indices, which were related to variables extracted from field samples. The °Brix modeling presents an R2 of 69% and 73% in the 2017 and 2018 seasons, respectively. In pH modeling, the 2017 season had low R2 results, reaching 43%, which then improves considerably in the 2018 season, reaching 63,8%. By choosing a model that allows defining the variability of the plot and the possible early or late ripening areas of the vineyard, is not only very useful but also very valuable to reach a constant improvement in production and hence in the wine quality. | es_ES |
| dc.description.abstract | [ES] Con el fin de monitorear la madurez y composición de las bayas de uva vinífera y determinar una fecha óptima de cosecha, es vital la determinación de °Brix y pH. Esta investigación comprende el estudio de dos temporadas de cosecha de uva vinífera de variedad Cabernet Sauvignon: 2017 y 2018. Periodo en el cual se tomaron periódicamente datos de campo que permitieron seguir el estado fenológico de la vid hasta el momento de la cosecha y posterior vinificación. Incorporar soluciones tecnológicas, como el uso de imágenes satelitales, en este caso Sentinel-2, al proceso de muestreo de fruta, permite optimizar un proceso artesanal, dando la posibilidad de tener una visión más detallada del cuartel, lo que hace más eficiente el trabajo de terreno. Desde las imágenes se obtuvieron 12 variables compuestas por 8 bandas y 4 indicadores (NDVI, NDMI, Clorofila y GNDVI) que se relacionaron con variables extraídas de muestreos de campo. Con dichos datos se seleccionó el mejor modelo de regresión lineal múltiple, utilizando 3 variables para predecir °Brix y pH. La modelación de °Brix presenta un coeficiente de determinación R2 de 69% y 73% en las temporadas 2017 y 2018, respectivamente. En el caso de la modelación de pH, la temporada 2017 tiene bajos resultados de R2, alcanzando un 43%, el cual mejora considerablemente en la temporada 2018, alcanzando un 63.8%. Determinar un modelo que permita definir la variabilidad de la parcela y, por tanto, las posibles zonas de maduración temprana o tardía del viñedo, es de gran utilidad para concretar una mejora en la producción y por ende en la calidad del vino. | es_ES |
| dc.format.extent | 10 | es_ES |
| dc.language | Español | es_ES |
| dc.publisher | Editorial Universitat Politècnica de València | es_ES |
| dc.relation.ispartof | Proceedings 3rd Congress in Geomatics Engineering | |
| dc.rights | Reconocimiento - No comercial - Sin obra derivada (by-nc-nd) | es_ES |
| dc.subject | Geocomputing | es_ES |
| dc.subject | 3D Modelling | es_ES |
| dc.subject | Cultural Heritage | es_ES |
| dc.subject | Geodesy | es_ES |
| dc.subject | Geophysics | es_ES |
| dc.subject | Earth observation | es_ES |
| dc.subject | Cartography | es_ES |
| dc.subject | Environmental applications | es_ES |
| dc.subject | °brix | es_ES |
| dc.subject | PH | es_ES |
| dc.subject | Sentinel-2 | es_ES |
| dc.subject | Precision of viticulture | es_ES |
| dc.subject | Remote sensing | es_ES |
| dc.title | Modelación de °Brix y pH en uva vinífera mediante imágenes satelitales. Valle de Colchagua, Chile | es_ES |
| dc.title.alternative | Modeling °Brix and pH in wine grapes from satellite images in Colchagua valley, Chile | es_ES |
| dc.type | Capítulo de libro | es_ES |
| dc.type | Comunicación en congreso | es_ES |
| dc.identifier.doi | 10.4995/CiGeo2021.2021.12734 | |
| dc.rights.accessRights | Abierto | es_ES |
| dc.contributor.affiliation | Universitat Politècnica de València. Departamento de Ingeniería Cartográfica Geodesia y Fotogrametría - Departament d'Enginyeria Cartogràfica, Geodèsia i Fotogrametria | es_ES |
| dc.contributor.affiliation | Universitat Politècnica de València. Escuela Técnica Superior de Ingeniería Geodésica, Cartográfica y Topográfica - Escola Tècnica Superior d'Enginyeria Geodèsica, Cartogràfica i Topogràfica | es_ES |
| dc.description.bibliographicCitation | Fredes, S.; Ruiz Fernández, LÁ.; Recio Recio, JA. (2021). Modelación de °Brix y pH en uva vinífera mediante imágenes satelitales. Valle de Colchagua, Chile. En Proceedings 3rd Congress in Geomatics Engineering. Editorial Universitat Politècnica de València. 258-267. https://doi.org/10.4995/CiGeo2021.2021.12734 | es_ES |
| dc.description.accrualMethod | OCS | es_ES |
| dc.relation.conferencename | 3rd Congress in Geomatics Engineering | es_ES |
| dc.relation.conferencedate | Julio 07-08, 2021 | es_ES |
| dc.relation.conferenceplace | Valencia, Spain | es_ES |
| dc.relation.publisherversion | http://ocs.editorial.upv.es/index.php/CIGeo/CiGeo2021/paper/view/12734 | es_ES |
| dc.description.upvformatpinicio | 258 | es_ES |
| dc.description.upvformatpfin | 267 | es_ES |
| dc.type.version | info:eu-repo/semantics/publishedVersion | es_ES |
| dc.relation.pasarela | OCS\12734 | es_ES |


