JavaScript is disabled for your browser. Some features of this site may not work without it.
Buscar en RiuNet
Listar
Mi cuenta
Estadísticas
Ayuda RiuNet
Admin. UPV
Visualizing the critique: Strengthening quantitative reasoning skills through design
Mostrar el registro sencillo del ítem
Ficheros en el ítem
| dc.contributor.author | Weinstein, Kathryn
|
es_ES |
| dc.date.accessioned | 2017-11-14T10:16:55Z | |
| dc.date.available | 2017-11-14T10:16:55Z | |
| dc.date.issued | 2016-10-27 | |
| dc.identifier.isbn | 9788490484753 | |
| dc.identifier.uri | http://hdl.handle.net/10251/90981 | |
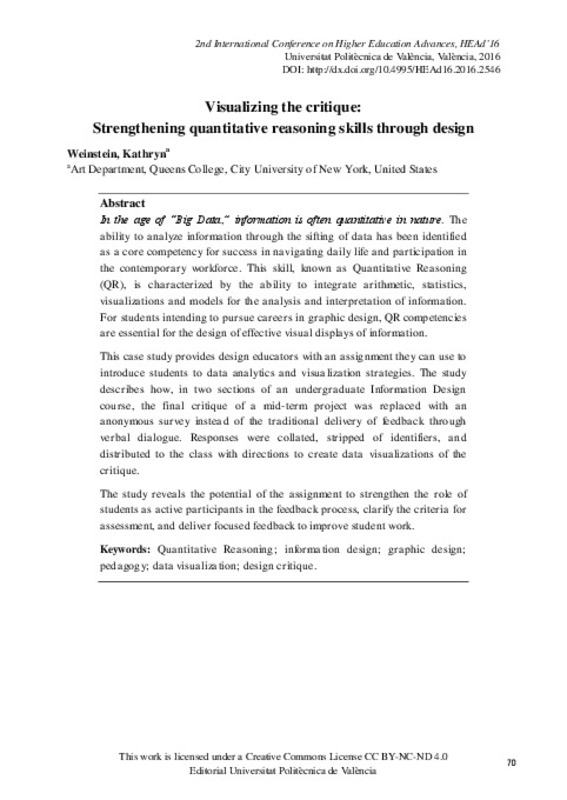
| dc.description.abstract | [EN] In the age of “Big Data,” information is often quantitative in nature. The ability to analyze information through the sifting of data has been identified as a core competency for success in navigating daily life and participation in the contemporary workforce. This skill, known as Quantitative Reasoning (QR), is characterized by the ability to integrate arithmetic, statistics, visualizations and models for the analysis and interpretation of information. For students intending to pursue careers in graphic design, QR competencies are essential for the design of effective visual displays of information. This case study provides design educators with an assignment they can use to introduce students to data analytics and visualization strategies. The study describes how, in two sections of an undergraduate Information Design course, the final critique of a mid-term project was replaced with an anonymous survey instead of the traditional delivery of feedback through verbal dialogue. Responses were collated, stripped of identifiers, and distributed to the class with directions to create data visualizations of the critique. The study reveals the potential of the assignment to strengthen the role of students as active participants in the feedback process, clarify the criteria for assessment, and deliver focused feedback to improve student work. | es_ES |
| dc.format.extent | 8 | es_ES |
| dc.language | Inglés | es_ES |
| dc.publisher | Editorial Universitat Politècnica de València | es_ES |
| dc.relation.ispartof | 2nd. International conference on higher education advances (HEAD'16) | es_ES |
| dc.rights | Reconocimiento - No comercial - Sin obra derivada (by-nc-nd) | es_ES |
| dc.subject | Higher Education | es_ES |
| dc.subject | Learning | es_ES |
| dc.subject | Educational systems | es_ES |
| dc.subject | Teaching | es_ES |
| dc.subject | Quantitative Reasoning | es_ES |
| dc.subject | Information design | es_ES |
| dc.subject | Graphic design | es_ES |
| dc.subject | Pedagogy | es_ES |
| dc.subject | Data visualization | es_ES |
| dc.subject | Design critique | es_ES |
| dc.title | Visualizing the critique: Strengthening quantitative reasoning skills through design | es_ES |
| dc.type | Capítulo de libro | es_ES |
| dc.type | Comunicación en congreso | es_ES |
| dc.identifier.doi | 10.4995/HEAD16.2015.2546 | |
| dc.rights.accessRights | Abierto | es_ES |
| dc.description.bibliographicCitation | Weinstein, K. (2016). Visualizing the critique: Strengthening quantitative reasoning skills through design. En 2nd. International conference on higher education advances (HEAD'16). Editorial Universitat Politècnica de València. 70-77. https://doi.org/10.4995/HEAD16.2015.2546 | es_ES |
| dc.description.accrualMethod | OCS | es_ES |
| dc.relation.conferencename | Second International Conference on Higher Education Advances | es_ES |
| dc.relation.conferencedate | June 21-23,2016 | es_ES |
| dc.relation.conferenceplace | Valencia, Spain | es_ES |
| dc.relation.publisherversion | http://ocs.editorial.upv.es/index.php/HEAD/HEAD16/paper/view/2546 | es_ES |
| dc.description.upvformatpinicio | 70 | es_ES |
| dc.description.upvformatpfin | 77 | es_ES |
| dc.type.version | info:eu-repo/semantics/publishedVersion | es_ES |
| dc.relation.pasarela | OCS\2546 | es_ES |


